Evaluate light uniformity with UGR and CV
This guide shows how to objectively evaluate the uniformity of your cannabis lighting with actionable metrics such as Uniformity Grid Ratio and Coefficient of Variation.
## Introduction
A high average PPFD alone does not mean good lighting. Two setups can deliver the same average value but be distributed completely differently across the surface. This is exactly where **light uniformity figures** can help. This guide does not deal with the general PPFD basis, no lamp comparisons and no shadow management through training, but the **mathematical evaluation of the illumination quality** on the canopy surface.
This is important for cannabis because uneven lighting often leads to a crop in which individual plant areas are significantly more or less illuminated than others. The aim is therefore not just "lots of light", but **predictably distributed light**.
## What is meant by uniformity
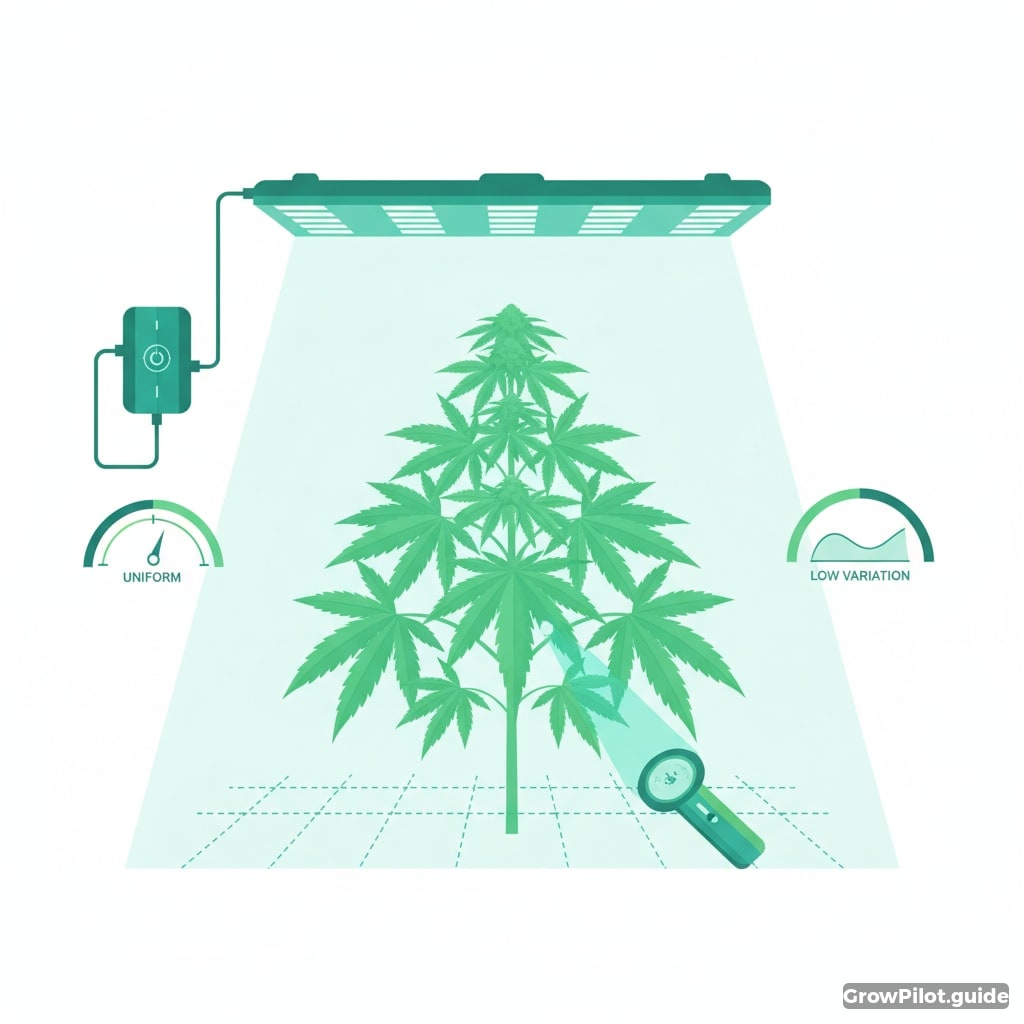
Uniformity describes how similar the PPFD values are within the usable cultivation area. The smaller the deviations between the measuring points, the more uniform the illumination.
Important key figures are
- **Minimum/maximum ratio**: roughly shows how much edge fall-off or hotspots occur
- **UGR (Uniformity Grid Ratio)**: can practically be used as a ratio of the lowest to average PPFD value in the grid
- CV (coefficient of variation)**: describes the dispersion of all measured values relative to the mean value
These key figures supplement the average value. An average value of 800 µmol/m²/s can be good or bad - the decisive factor is **how strongly the individual values scatter**.
## Determine the correct measurement basis
Before you calculate, you need a clean measuring grid at **canopy height**. Measurements are always taken where the leaf or flower surface actually receives light.
### Grid size
A **3×3 or 4×4 grid** is often sufficient for small areas. Larger areas benefit from more measuring points. What is important is not absolute perfection, but a **regular, reproducible grid**.
### Don't forget the edge points
Many growers measure too much in the middle. However, **corners and edge zones** are crucial for uniformity assessment because this is where the greatest PPFD drop typically occurs.
### Always measure under stable conditions
- Operate the lamp at the power actually used
- Always measure at the same suspension height
- Align the sensor horizontally
- Do not use a single measurement as a basis
## Practical calculation of UGR
For indoor grow is a simple, useful form:
**UGR = lowest PPFD value / average PPFD value**
Example:
- Average in the grid: 780 µmol/m²/s
- Lowest value: 590 µmol/m²/s
- UGR = 590 / 780 = **0.76**
Interpretation:
- **>0.80**: very uniform
- **0.70-0.80**: good to usable
- **<0.70**: significant edge loss or poor distribution
This classification is practical, even if manufacturers sometimes use other uniformity metrics. For hobby growers, it is crucial that you **always use the same method** to compare setups.
## CV as a more precise dispersion metric
The **coefficient of variation (CV)** is mathematically more meaningful than just minimum and mean.
Formula:
**CV = standard deviation / mean value × 100**
Example:
- Mean value: 780 µmol/m²/s
- Standard deviation: 78
- CV = 78 / 780 × 100 = **10 %**
Practical evaluation:
- **under 10 %**: very even distribution
- 10-15 %**: solid
- **over 15 %**: visibly uneven
The advantage of CV: Even if there is no single extreme value, you can recognize whether the entire field is unevenly illuminated.
## What the key figures in the phases mean
### Vegetation phase
In the vegetation phase, clean uniformity is helpful to promote **even structural development**. Large differences in PPFD often lead to uneven growth within the same area.
### Flowering phase
Uniformity becomes even more important in the flowering phase, because differences in the amount of light can lead directly to **uneven flower development**. Especially with high target values, the area should not only be bright, but **controlled homogeneous**.
Autoflower note: **Autoflower plants do not require a 12/12 light cycle**, but the uniformity assessment of the surface works the same for them as for photoperiodic plants.
## How to specifically improve poor uniformity
If UGR is low or CV is high, correct the **light layout** first, not the overall performance immediately.
Useful measures:
- Hang lamp slightly higher if there are strong hotspots in the center
- Use several smaller light sources instead of one point source
- Prefer bar-style LEDs for rectangular surfaces
- Align luminaires symmetrically to the usable area
- Do not evaluate the entire tent area, but only the **actually used canopy area**
Important: More power does not automatically improve uniformity. Often only the average value increases, while the distribution remains poor.
## Conclusion
If you want to assess lighting more professionally, you should not stop at the average PPFD. **UGR and CV make visible how well the light is actually distributed, allowing you to compare setups more objectively, identify edge problems and plan the usable area more realistically. For stable results, it's not just light quantity that counts, but **measurably uniform light quality over the entire canopy**.
## Pro Tips
- Always compare uniformity at the same lamp height.
- A 4×4 grid is sufficient for many home grows.
- Evaluate not only the mean value, but always also the CV or UGR.
- Poor corners often indicate an unsuitable lamp layout.
- Autoflowers do not need a 12/12 flip to flower.
🌿 More Growing Knowledge & Smart Grow Help
GrowPilot.guide is the cannabis grow tracker and weed cultivation app with smart plant analysis, indoor cannabis growing guide, grow diary, community, cups and autoflower grow tracker for growers worldwide.
Open GrowPilot.guide App →